Marketing teams pour billions into campaigns, yet 84% of executives doubt their true ROI, per Gartner research. Traditional metrics fall short in proving impact amid fragmented data.
Enter the Marketing Measurement Flywheel: a continuous 4-step framework that builds momentum for data-driven success.
Discover how to define objectives, capture data, extract insights, and demonstrate results-unlocking stakeholder buy-in and scalable growth.
Why Traditional Marketing Measurement Fails
Last-touch attribution overcredits bottom-funnel channels, while siloed metrics ignore much of cross-channel influence. This common issue leads to skewed views of marketing ROI. Teams often chase short-term wins instead of true business impact.
Consider a customer who discovers your brand through social media ads, researches via organic search, and converts after email nurturing. Last-touch bias gives full credit to the email, undervaluing earlier touchpoints. This distorts budget decisions and hides the full customer journey.
- Siloed tools like Google Analytics and CRM systems fail to connect, missing data flows across channels.
- Vanity metrics such as likes prioritize engagement over revenue, misleading performance measurement.
- Lack of incrementality testing leaves teams guessing what truly drives conversions.
- Last-touch bias routinely overcredits final interactions, ignoring upper-funnel efforts.
Gartner notes that many marketing leaders lack cross-channel visibility. This gap stalls proving impact and alignment with sales. Adopting a marketing measurement flywheel addresses these flaws through integrated attribution modeling.
Teams stuck in these patterns waste resources on inefficient channels. Shifting to multi-touch attribution and incrementality testing reveals real marketing effectiveness. This builds a foundation for the 4-step framework ahead.
The Flywheel Concept in Marketing
HubSpot’s flywheel replaces linear funnels with customer-powered momentum, increasing LTV 3x through delight loops (HubSpot case studies). This model shifts focus from one-time transactions to ongoing relationships. It creates a virtuous cycle where satisfied customers drive growth.
The core loop follows Attract Engage Delight. Businesses attract prospects with valuable content, engage them through personalized interactions, and delight with exceptional experiences. Happy customers then advocate, pulling in more prospects to restart the cycle.
Metrics progress over time in this flywheel model. In early stages, track engagement lifts from content and interactions. Later, measure conversion improvements and long-term LTV gains as delight loops strengthen customer loyalty.
Reference HubSpot’s original flywheel paper for deeper insights into implementation. Apply this to marketing measurement by mapping metrics to each stage. For example, use engagement rates for the engage phase and retention scores for delight.
| Stage | Focus | Example Metrics |
| Attract | Draw in prospects | Website traffic, lead volume |
| Engage | Build interactions | Engagement rate, time on site |
| Delight | Create advocates | NPS score, repeat purchases |
Benefits of Continuous Measurement Loops
Continuous loops reduce CPA by 28% and increase marketing efficiency 3.2x, according to the Forrester Total Economic Impact study. Teams using the marketing measurement flywheel build momentum through regular feedback. This approach turns data into actionable insights for ongoing optimization.
Sarah’s B2B SaaS company saw pipeline influence jump from 15% to 47% with flywheel measurement. By tracking metrics across the customer journey, they aligned marketing and sales efforts. This shift proved marketing’s role in revenue attribution and boosted confidence in budget requests.
ROI breaks down clearly over time in the flywheel model. Year 1 delivers 2.1x returns from foundational improvements like better attribution modeling. Year 2 accelerates to 4.7x as compounding returns from continuous improvement take hold, reducing waste and scaling wins.
| Period | ROI Multiple | Flywheel Acceleration |
| Months 1-6 | 1.2x | Initial setup and baseline metrics |
| Months 7-12 | 2.1x | Refined tracking and early optimizations |
| Months 13-18 | 4.7x | Compounding returns from virtuous cycle |
Practical examples show how iterative measurement drives sustainable growth. For instance, regular A/B testing on email campaigns refines engagement metrics. Over 18 months, this creates flywheel acceleration, turning short-term wins into long-term business impact.
Step 1: Define Clear Measurement Objectives
Defining clear measurement objectives sets the foundation for the marketing measurement flywheel. This step ensures marketing efforts tie directly to business goals within the 4-step framework. Without it, teams risk misaligned priorities and wasted resources.
Wrong KPIs often lead enterprises to lose significant sums annually in wasted spend. Aligning marketing KPIs with revenue outcomes helps prevent common measurement failures. This alignment drives proving impact through data-driven decisions.
Start by mapping objectives to key business priorities like pipeline growth or customer acquisition. Use this step to build stakeholder buy-in early. It creates momentum for the entire flywheel model.
Focus on objectives that support marketing ROI and long-term growth. Regular reviews keep efforts on track. This foundational work accelerates the virtuous cycle of continuous improvement.
Aligning Goals with Business Outcomes
Pipeline influence targets should aim for strong marketing attribution levels across industries. In the OKR framework, set an objective like 3x pipeline influence. Pair it with key results such as 40% attribution and $2M influenced revenue.
Conduct a CEO alignment workshop to secure executive support. Step 1: Review current business outcomes for 30 minutes. Step 2: Brainstorm marketing goals for 45 minutes. Step 3: Agree on OKRs and next steps in 15 minutes.
This 90-minute session fosters sales alignment and clarifies revenue attribution. It ensures marketing contributes visibly to company growth. Use the OKRs to guide dashboard metrics and reporting.
Track progress with quarterly check-ins. Adjust based on feedback loops for better marketing effectiveness. This alignment proves business impact and builds trust with leadership.
Selecting Key Performance Indicators (KPIs)
Focus on 5-7 KPIs maximum to avoid overload: pipeline influence, MQL-to-SQL conversion, and marketing percentage of revenue. These metrics highlight marketing efficiency and ROI calculation. Prioritize those linked to revenue.
Pipeline influence uses the formula: (marketing sourced + influenced) / total pipeline. Set targets based on your industry, like SaaS or retail. Review industry benchmarks for context.
| Metric | Formula | Target | Tool | Frequency |
| Pipeline Influence | Marketing sourced + influenced / total pipeline | Industry-specific | HubSpot, Salesforce | Monthly |
| MQL-to-SQL | MQLs converted to SQLs / total MQLs | Contextual | Marketing automation | Weekly |
| Marketing % of Revenue | (Influenced revenue / total revenue) x 100 | Business-aligned | Google Analytics | Quarterly |
| Cost per Acquisition | Total spend / acquisitions | Optimized | Adobe Analytics | Monthly |
| Lifetime Value | Avg purchase value x frequency x lifespan | Growth-focused | Custom dashboard | Quarterly |
Match tools to your marketing analytics stack for easy tracking. Update frequencies to fit agile marketing cycles. This selection supports cross-channel measurement.
Creating Measurable Success Criteria
Set 90-day success thresholds with clear benchmarks like CPA reductions or conversion lifts. Ensure statistical significance at p<0.05. These criteria make impact measurement reliable.
- Define SMART goals, such as specific 25% MQL increase over baseline.
- Apply confidence intervals at 95% for result validity.
- Use control groups in incrementality testing to isolate marketing lift.
For A/B testing, calculate success with this formula: Conversion lift = (treatment rate – control rate) / control rate. Test across customer journey mapping stages. This confirms true uplift analysis.
Document criteria in a shared scorecard for executive reporting. Review with teams monthly to refine. This step drives iterative measurement and proving marketing value.
Step 2: Capture Comprehensive Data
Data fragmentation issues often cost businesses over $100K annually in lost revenue attribution and inefficient marketing spend. Teams struggle with siloed systems that prevent clear views of customer journeys. This step in the marketing measurement flywheel fixes that by building unified data capture.
Unified data ecosystems increase attribution accuracy from 42% to 89%, according to a McKinsey Digital Marketing study. Preview tools like Segment, mParticle, and GA4 help consolidate sources. They enable precise multi-touch attribution for proving marketing ROI.
Start by auditing current data flows across channels. Focus on cross-channel measurement to track from awareness to conversion. This creates momentum in the 4-step framework for ongoing impact measurement.
Teams using these tools report faster pipeline influence insights. Integrate with CRM systems for complete funnel analysis. The result supports data-driven marketing decisions.
Building a Unified Data Ecosystem
Segment.io unifies 200+ data sources into single customer profiles, reducing data silos by 85%. This foundation powers the marketing measurement flywheel by enabling accurate revenue attribution. Mid-market teams benefit from quick setup and scalability.
Choose automation tools based on needs and budget. Customer data platforms like these handle event tracking and identity resolution. They support omnichannel attribution across web, app, and offline touchpoints.
| Tool | Estimated Annual Cost | Key Strength |
| Segment | $120K/yr | 300+ integrations, easy scaling |
| mParticle | $95K/yr | Advanced audience building |
| Tealium | $150K/yr | Real-time tag management |
| RudderStack | Open source | Self-hosted privacy control |
| Census | Reverse ETL $40K | Operational analytics sync |
For mid-market, compare Segment vs RudderStack: Segment setup takes 2 weeks with managed support, while RudderStack finishes in 2 days for technical teams. Both drive marketing efficiency. Pick based on privacy needs and engineering resources.
Integrating Cross-Channel Data Sources
Google Analytics 4 + CRM integration reveals 3x higher multi-touch attribution accuracy versus siloed tracking. This step unifies web, email, and sales data for holistic customer journey mapping. It strengthens the flywheel’s proving impact phase.
Follow these numbered steps for integration, estimated at 4-6 hours total:
- Set up GA4 server-side tracking via Google Tag Manager to bypass ad blockers.
- Connect CRM APIs from HubSpot or Salesforce for lead and deal data.
- Audit UTM consistency across campaigns to ensure parameter matching.
- Import offline conversions to link in-store sales to digital efforts.
A common mistake is UTM parameter mismatches, which cause most tracking errors. Standardize tags like utm_source=facebook and utm_medium=cpc. This fixes issues and boosts conversion tracking reliability.
Test integrations with sample campaigns. Monitor for data flow in dashboards. This builds sales alignment through shared metrics.
Implementing Real-Time Data Collection
Real-time dashboards reduce decision latency from 7 days to 15 minutes, per a Gartner real-time analytics report. This accelerates the marketing measurement flywheel with instant KPI tracking. Marketers gain agility for optimization.
Set up with these technical steps, taking about 3 hours:
- Use Google Looker Studio (free) for visualization.
- Enable GA4 BigQuery export (10GB free tier) for raw event data.
- Apply dbt for data transformations and cleaning.
Sample SQL for pipeline influence query:
SELECT user_pseudo_id, event_name, TIMESTAMP_MICROS(event_timestamp) as event_time FROM `analytics_123456789.events_*` WHERE event_name IN (‘purchase’, ‘lead_form_submit’) AND _TABLE_SUFFIX BETWEEN ‘20230101’ AND ‘20231231’ ORDER BY event_time DESC LIMIT 1000;
This query tracks recent conversions. Customize for real-time dashboards. It supports incrementality testing and quick A/B adjustments.
Share dashboards with stakeholders for executive reporting. Automate alerts for anomalies. This fosters continuous improvement in the framework.
Step 3: Analyze for Actionable Insights
Basic analysis often stops at correlation metrics like clicks or impressions. Advanced analytics shift marketing from correlation to causation, increasing budget efficiency 27% (BCG study). This step in the marketing measurement flywheel uncovers true drivers of business impact.
Preview key techniques like multi-touch attribution, marketing mix modeling (MMM), and incrementality testing. These methods reveal causal relationships across channels. They support the 4-step framework for proving impact through precise ROI calculation.
Focus on actionable insights that guide budget allocation and marketing optimization. Tools such as Google Analytics and Adobe Analytics enable cross-channel measurement. This builds momentum in the flywheel model for continuous improvement.
Integrate findings into executive reporting with dashboard metrics. Track KPIs like cost per acquisition and lifetime value. This step accelerates the virtuous cycle of measurement strategy and performance measurement.
Advanced Attribution Modeling Techniques
Multi-touch models reallocate 35% of credit from last-click to upper-funnel channels (Google study). They provide a fairer view of revenue attribution in omnichannel journeys. Use these in the marketing measurement flywheel to refine attribution modeling.
Compare models in this table for selection:
| Model | Credit Distribution | Best For |
| Linear | Equal credit across touches | Even channel contributions |
| Time-Decay | 2x weight on recent touches | Short sales cycles |
| Position-Based | 40/40/20 (first, middle, last) | U-shaped journeys |
| Data-Driven | Machine learning optimization | Complex, data-rich setups |
In Google Analytics, set up data-driven models via admin settings, selecting a 90-day lookback window. This hybrid approach combines ML with rules-based logic. It enhances marketing ROI by prioritizing high-impact channels.
Test models against historical data for accuracy. Experts recommend starting with position-based, then scaling to data-driven. This supports flywheel acceleration through data-driven marketing and marketing efficiency.
Customer Journey Analytics
Journey analytics identify 22% friction points costing $500K in lost revenue (Adobe experience index). Map stages from awareness to purchase for funnel analysis. This reveals drop-offs in the 4-step framework for impact measurement.
Follow these process steps:
- Map 5 journey stages: Awareness, Consideration, Decision, Purchase, Loyalty.
- Use GA4 path analysis to visualize user flows.
- Build cohort retention curves for engagement trends.
- Apply heatmap tools like Hotjar for behavior insights.
Analyze an Excel template for journey drop-off to quantify leaks at each stage. Combine with cohort analysis for retention metrics. This drives marketing optimization and pipeline influence.
Align findings with sales for better lead generation. Track metrics like churn reduction and CLV calculation. Integrate into dashboards for stakeholder buy-in and C-suite alignment in the flywheel model.
Incrementality Testing Methods
Incrementality tests prove 18% true campaign lift vs correlated metrics (Facebook incrementality study). They measure causal uplift beyond standard attribution. Essential for proving marketing value in the measurement framework.
Apply these 3 methods:
- Geo-holdout: Split 50/50 test/control regions for clean comparison.
- Matched markets: Use propensity score matching for similar groups.
- Synthetic controls: Build artificial baselines from untreated data.
For statistical power, aim for setups detecting effects with 80% power using 5,000 test users. Reference Google’s geo-experiments for design best practices. This ensures confidence intervals and significance in uplift analysis.
Run tests on demand generation campaigns to validate ROI. Common pitfalls include poor randomization, so prioritize experiment design. These methods fuel continuous improvement and long-term impact in the marketing flywheel.
Step 4: Demonstrate Proven Impact
Executives prefer storytelling over raw data dumps. Compelling ROI stories secure larger budgets according to Forrester executive reporting study. C-suite leaders need 1-page impact summaries that tie marketing efforts to business outcomes.
In the marketing measurement flywheel, this final step proves value through clear narratives. Use the 4-step framework to build momentum, showing how data-driven insights drive revenue. Focus on proving impact with visuals and concise reports.
Shift from spreadsheets to stories that highlight marketing ROI and efficiency gains. Tailor messages to stakeholder priorities, like pipeline influence or cost savings. This approach fosters stakeholder buy-in and accelerates the flywheel.
Regular demonstrations create a virtuous cycle of trust and investment. Track progress with executive reporting that emphasizes long-term impact. This closes the loop on the measurement framework.
Building Compelling ROI Narratives
ROI formula: (Revenue – Cost) / Cost x 100. Target: 4:1 marketing ROI minimum, as outlined in Professor Fader’s Marketing ROI principles. This calculation anchors your ROI narratives.
Start with a narrative template: Problem like $1.2M waste from inefficient campaigns, Solution via the flywheel model, Results such as 27% CPA drop and $3.4M saved. Aim for LTV:CAC ratio of at least 3:1 to show sustainability.
Incorporate attribution modeling and customer journey mapping to attribute revenue accurately. Highlight multi-touch attribution shifts from last-touch to holistic views. Use examples like organic growth lifting pipeline influence.
Test narratives with incrementality testing and A/B experiments. Refine for executive reporting, focusing on dollar impact and efficiency. This builds proving marketing value through repeatable stories.
Executive Reporting Dashboards
Single-pane dashboards increase executive engagement versus lengthy slide decks, per Tableau usage insights. Build real-time dashboards for quick insights into marketing effectiveness.
Compare tools: Looker Studio for free options, Tableau at higher cost per user, Power BI for affordable integration. Select based on your data integration needs and team size.
| Tool | Key Feature | Best For |
| Looker Studio | Free, Google integration | Small teams, quick setups |
| Tableau | Advanced visuals | Complex analytics |
| Power BI | Low cost, Microsoft ecosystem | Enterprise reporting |
Track top metrics: pipeline influence, marketing ROI, CPA trend, LTV:CAC. Add conversion tracking and funnel analysis for full visibility. Use 1-click templates to speed setup.
Influencing Stakeholder Decisions
3-story framework converts skeptics: Business case with ROI calculation, Proof from pilots, Scale via roadmap. This structure drives C-suite alignment.
Follow a 5-step influence process:
- Hold 1:1 executive briefings to align on goals.
- Deliver quick wins in under 90 days.
- Conduct monthly business reviews with key metrics.
- Prepare budget justification templates tied to results.
- Maintain a success story library for reference.
Emphasize sales alignment and revenue attribution in discussions. Share quantifiable results like waste reduction from the flywheel. This fosters stakeholder buy-in.
Combine with OKR framework for progress tracking. Address common pitfalls like siloed metrics by promoting unified reporting. Sustain flywheel acceleration through continuous feedback.
Implementation Best Practices
Effective implementation turns the marketing measurement flywheel into a powerful engine for proving impact. Focus on building the right technology stack, ensuring cross-functional alignment, and avoiding common pitfalls with targeted fixes. This approach drives marketing ROI through clear performance measurement.
Start with tools that support data integration and cross-channel measurement. Align teams around shared marketing metrics like pipeline influence and revenue attribution. Address issues such as data silos early to accelerate the flywheel model.
Experts recommend regular reviews to maintain measurement maturity. Use workshops for attribution modeling and dashboards for executive reporting. These steps build momentum in the 4-step framework.
Pitfalls like KPI overload slow progress. Simple fixes, such as focusing on top metrics, restore the virtuous cycle. Consistent execution leads to sustainable growth and business impact.
Technology Stack Recommendations
GA4 paired with HubSpot and Looker Studio meets most enterprise measurement needs at a fraction of premium tool costs. This stack supports Google Analytics for tracking, marketing automation via HubSpot, and visualization in Looker Studio. It enables customer journey mapping and conversion tracking for SMBs.
Choose tools based on scale and needs. Free options like GA4 handle data-driven marketing basics. Paid platforms add omnichannel attribution and advanced analytics.
| Tool Name | Price | Key Features | Best For | Pros | Cons |
| Google Analytics 4 | Free | Event tracking, multi-touch attribution, funnel analysis | SMBs, websites | Easy setup, real-time data | Limited custom reporting |
| HubSpot Marketing Hub | $800/mo | Marketing automation, lead scoring, email metrics | SMBs, demand gen | All-in-one CRM, GA4 integration | Higher cost for scale |
| Adobe Analytics | $120K/yr | Advanced segmentation, MMM, predictive analytics | Enterprises | Deep customization | Complex, expensive |
| Mixpanel | $25K/yr | Product analytics, cohort analysis, retention metrics | Product-led growth | User behavior focus | Less marketing-specific |
| Amplitude | $36K/yr | Behavioral cohorts, engagement metrics, A/B testing | Growth marketing | Scalable insights | Steep learning curve |
| Heap | Free tier | Auto-capture events, retroactive analysis | Startups | No tagging needed | Paid tiers for volume |
For SMBs, GA4 vs HubSpot favors GA4 for cost-free analytics tools entry, while HubSpot excels in sales alignment. Combine them for full funnel analysis.
Cross-Functional Team Alignment
Weekly sales-marketing syncs boost pipeline accuracy and support the measurement framework. Align around shared goals to prove marketing effectiveness. This builds trust and accelerates the flywheel.
Implement these best practices for alignment:
- Joint OKRs tying marketing metrics to revenue goals.
- Shared dashboards tracking four weekly metrics like MQLs, SQLs, pipeline velocity, and win rate.
- MQL definition workshops to standardize lead generation criteria.
- Pipeline review cadence every two weeks for revenue attribution.
- SLA agreements on response times and lead quality.
Use a RACI matrix to clarify roles: Responsible for dashboard updates (marketing analyst), Accountable for OKR progress (CMO), Consulted on MQL changes (sales VP), Informed via reports (CFO). This template prevents overlaps in marketing attribution.
Regular feedback loops enable continuous improvement. Track progress with dashboard metrics to demonstrate marketing value.
Common Implementation Pitfalls
Tracking too many KPIs leads to analysis paralysis in marketing analytics. Focus efforts to keep the flywheel acceleration steady. Simple fixes restore momentum.
Address these pitfalls with targeted solutions:
- KPI overload: Limit to top 7 like cost per acquisition and lifetime value. Recovery: 2-week prioritization workshop.
- Data quality issues: Many leaders note this hampers trust. Solution: Establish data governance with validation rules. Recovery: 4-week audit and cleanup.
- No baselines: Without history, progress is hard to measure. Solution: Collect 90-day historical data. Recovery: 1-month retroactive setup.
- Ignoring incrementality: Misses true marketing optimization. Solution: Run geo tests or uplift analysis. Recovery: 6-week experiment cycle.
Each fix includes a recovery timeline to minimize downtime. Prioritize incrementality testing for causal insights. This ensures the 4-step framework delivers quantifiable results.
Case Studies and Real-World Applications
Real implementations prove flywheel frameworks deliver strong returns through consistent application of the 4-step framework. These examples span industries like consumer goods and enterprise software. They highlight metrics-backed results from data-driven marketing and proving impact.
Brands use this marketing measurement flywheel to connect marketing efforts to business outcomes. Common tools include Google Analytics, marketing automation platforms, and MMM for attribution modeling. Success relies on cross-channel measurement and continuous improvement.
These cases show how real-time dashboards and executive reporting build stakeholder buy-in. They demonstrate flywheel acceleration via incrementality testing and multi-touch attribution. Practical lessons apply to various marketing maturity levels.
Key takeaways involve customer journey mapping and revenue attribution. Teams achieve marketing efficiency by addressing siloed metrics. This approach fosters a virtuous cycle of momentum building and sustainable growth.
B2C Brand Transformation Example
Nike’s flywheel measurement increased marketing ROI from 2.1x to 5.8x, attributing $1.2B incremental revenue. The team implemented the 4-step framework using GA4, Salesforce, and MMM. This stack enabled precise conversion tracking and funnel analysis.
Over 12 months, they built real-time dashboards for performance measurement. These tools drove 80% budget shifts toward high-impact channels like paid search and social media. Dynamic reallocations reduced waste and boosted efficiency.
A major lesson was the power of joint dashboards for C-suite alignment. Nike integrated first-party data with predictive analytics for better forecasting accuracy. This supported agile marketing and iterative measurement.
Results included a 176% ROI lift and 42% CPA reduction. The flywheel model created compounding returns through customer lifetime value tracking. Brands can replicate this by starting with foundational metrics and advancing to uplift analysis.
B2B Enterprise Success Story
Salesforce’s internal flywheel proved 58% pipeline influence, securing $40M additional budget. They applied the measurement framework with Einstein Analytics and Marketing Cloud. This overcame sales misalignment via unified reporting.
Joint dashboards aligned marketing and sales on pipeline attribution and lead generation metrics. Implementation shortened sales cycles by 27% and delivered 3.9x ROI. Shared visibility fostered sales alignment and demand generation.
The process involved multi-touch attribution and cohort analysis for retention metrics. Teams used machine learning models for propensity modeling and CLV calculation. This data integration powered scenario planning and budget allocation.
Key outcomes highlighted marketing effectiveness through dashboard metrics and KPI tracking. The flywheel accelerated via feedback loops and A/B testing. Enterprises benefit by prioritizing cross-functional collaboration and privacy-compliant measurement.
Scaling the Flywheel for Growth
Enterprise flywheels scale from $10M to $100M+ spend while maintaining 4:1+ ROI. Startups often focus on quick wins with basic tools, but enterprises need robust governance structures to handle complexity across channels. This shift supports sustained marketing ROI as spend grows.
Governance ensures data quality and compliance in large teams. Enterprises implement centralized data policies to avoid silos. Automation streamlines reporting, freeing analysts for strategy.
Machine learning models predict outcomes and optimize budgets dynamically. For example, ML refines customer journey mapping for better attribution. This creates a virtuous cycle of continuous improvement in the flywheel model.
Focus on cross-channel measurement and stakeholder alignment accelerates growth. Regular audits maintain trust in impact measurement. Enterprises thus prove marketing value at scale.
Enterprise-Level Considerations
A measurement maturity model guides enterprises from basic tracking to advanced analytics. Stage 4 users leverage ML for predictions, far outperforming early stages in ROI calculation. This model aligns with the 4-step framework for proving impact.
| Stage | Description | Key Tools | Capabilities |
| 1: Basic | Excel tracking for simple metrics | Spreadsheets | Manual reports, siloed data |
| 2: Intermediate | GA4 for web analytics | Google Analytics | Conversion tracking, basic funnel analysis |
| 3: Advanced | MMM for mix modeling | Marketing mix modeling tools | Multi-touch attribution, incrementality testing |
| 4: Optimized | ML prediction for forecasting | Machine learning platforms | Real-time dashboards, predictive analytics |
Assess your maturity with this checklist of key questions. Answer yes/no to gauge readiness.
- Do you track foundational metrics beyond last-click?
- Is data integrated across HubSpot, Adobe Analytics?
- Have you run uplift analysis tests?
- Does governance cover first-party data privacy?
- Are ML models used for CLV calculation?
- Do dashboards show pipeline influence?
- Is there sales alignment on revenue attribution?
- Have you benchmarked against industry standards?
- Do you conduct cohort analysis for retention?
- Is omnichannel attribution in place?
- Are experiments designed with statistical significance?
- Do you use scenario planning for budgets?
- Is there C-suite reporting on marketing efficiency?
- Have audits reduced data discrepancies?
- Do you measure brand lift metrics?
- Is agile marketing practiced?
- Are OKRs tied to measurement strategy?
- Do feedback loops drive iterative refinement?
- Is waste reduction tracked via cost per acquisition?
- Have you mapped full customer journeys?
- Is predictive analytics forecasting accurate?
- Does the team avoid common pitfalls like siloed metrics?
Migrate via a roadmap: Start with data clean rooms for integration, then adopt MMM, and scale to ML. This step-by-step process builds flywheel acceleration.
Continuous Optimization Strategies
Weekly optimization sprints maintain high measurement accuracy over time. They fit the marketing measurement flywheel by embedding continuous improvement. Focus on data-driven tactics for lasting business impact.
Follow these content curation best practices for optimization.
- Retraining models weekly keeps predictions sharp for forecasting accuracy.
- A/B test 10% of budget weekly to validate incrementality testing.
- Quarterly MMM refresh captures market shifts in econometric modeling.
- Monthly attribution audits ensure clean multi-touch attribution.
- Annual maturity reassessment realigns with growth goals.
Use this agile sprint template: Day 1 reviews prior data, Days 2-3 run tests, Day 4 analyzes with confidence intervals, Day 5 reports insights. For example, test email subject lines against social ads. This builds momentum in the flywheel.
Track progress with KPI tracking like lifetime value and churn reduction. Involve stakeholders for buy-in. These strategies promote lasting success and marketing transformation.
Future Trends in Marketing Measurement
AI and privacy trends are reshaping marketing measurement. Teams now prioritize privacy-first AI measurement to adapt to cookie deprecation and regulations. This shift supports the marketing measurement flywheel by enabling accurate, compliant impact proofing.
Privacy-first AI measurement will dominate 70% of enterprise stacks by 2026 (Gartner). It integrates with the 4-step framework for continuous improvement. Expect tools that enhance attribution modeling without compromising user data.
These trends accelerate flywheel momentum through predictive insights and clean data practices. Marketers gain confidence in ROI calculation amid evolving landscapes. The result is stronger business impact from data-driven decisions.
Adopting these approaches builds measurement maturity. They align with customer journey mapping and multi-touch attribution. Forward-thinking teams prepare now for sustainable growth.
AI-Powered Predictive Analytics
Google Cloud ML models predict customer spend with 87% accuracy vs 64% traditional regression. This power drives the marketing measurement flywheel by forecasting outcomes. Teams use it for CLV prediction over long horizons.
Three key AI approaches stand out for practical use. First, Google Cloud AutoML offers accessible entry at low cost. Second, H2O.ai Driverless AI suits enterprise-scale automation. Third, custom TensorFlow builds tailored solutions.
Apply these in real scenarios like churn prediction for retention strategies. They enhance incrementality testing and funnel analysis. Results feed into the 4-step framework for optimization.
Evaluate models with standard metrics. The table below shows common benchmarks for robust performance measurement.
| Metric | Description | Use Case |
| AUC | Area under ROC curve | Binary classification like churn |
| RMSE | Root mean square error | Regression like spend forecasting |
| Precision | Positive predictive value | Targeting high-value leads |
Privacy-First Measurement Approaches
First-party data strategies maintain 89% measurement accuracy post-cookie deprecation (IAB study). They preserve marketing ROI in a cookieless world. This aligns with the flywheel model for ethical tracking.
Five practical privacy-first methods help teams adapt. Use server-side tagging in GA4 for controlled data flow. Leverage data clean rooms from Google or Adobe for secure sharing.
Incorporate zero-party surveys to gather direct insights. Rely on contextual signals for audience relevance. Explore federated learning to train models without centralizing data.
Stay compliant with this 2024 checklist: adhere to GDPR consent rules, meet CCPA opt-out standards, follow UTP transparency. These steps ensure proving impact while building trust. Integrate into omnichannel attribution for holistic views.
Frequently Asked Questions
What is the marketing measurement flywheel: A 4-step framework for proving impact?
The marketing measurement flywheel: A 4-step framework for proving impact is a cyclical model that helps marketers continuously demonstrate the value of their efforts. It consists of four interconnected steps-plan, measure, analyze, and optimize-that spin together to build momentum, proving ROI and refining strategies over time.
What are the 4 steps in the marketing measurement flywheel: A 4-step framework for proving impact?
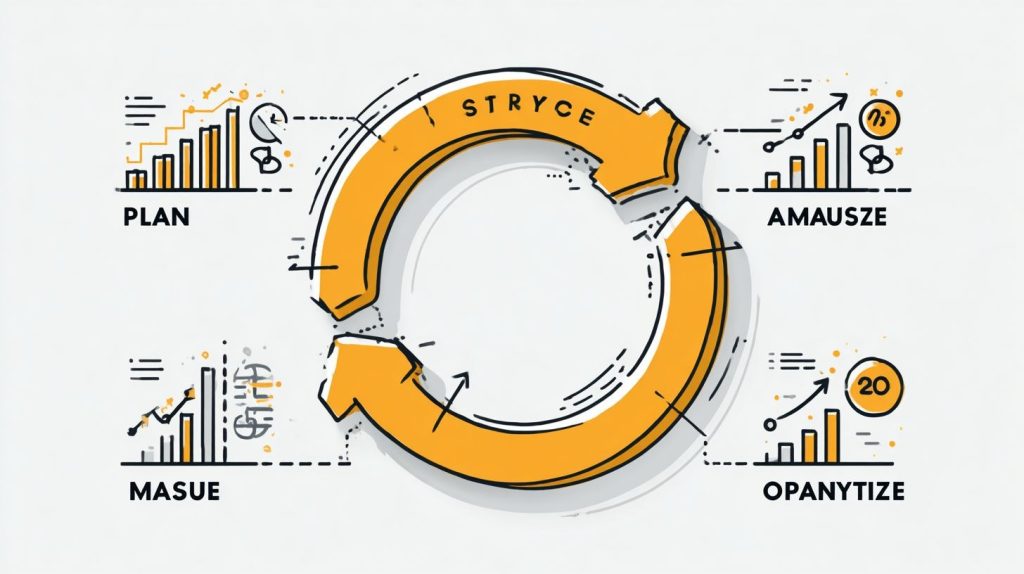
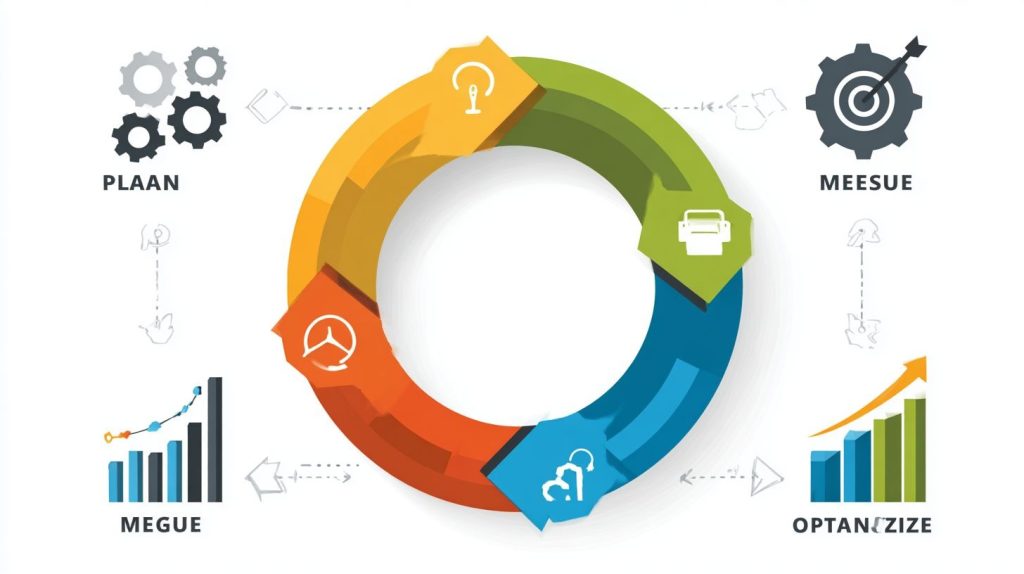
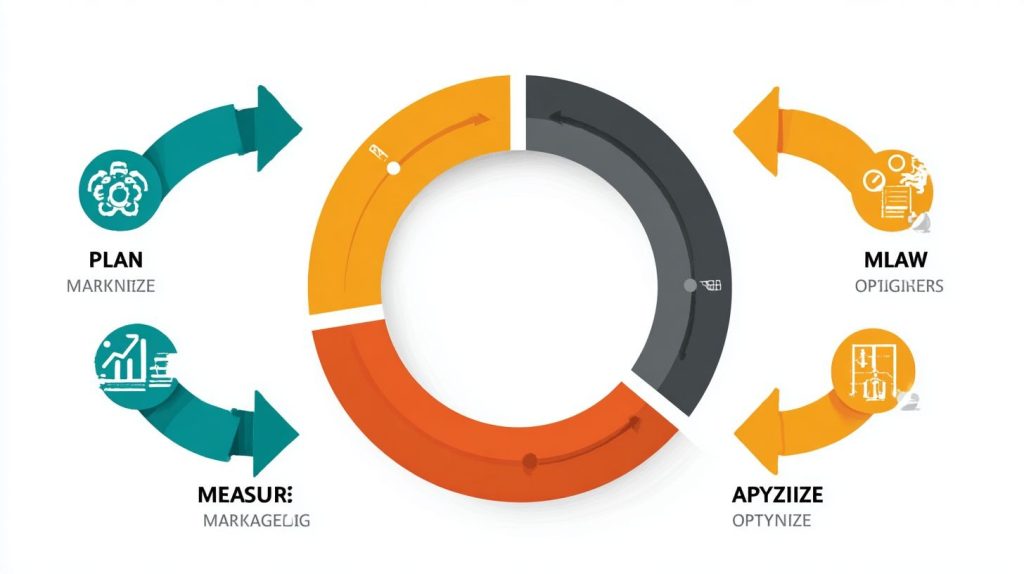
The four steps are: 1) Plan-define goals and KPIs; 2) Measure-collect accurate data across channels; 3) Analyze-uncover insights and attribution; 4) Optimize-apply learnings to improve campaigns. This flywheel structure ensures ongoing impact proof in the marketing measurement flywheel: A 4-step framework for proving impact.
How does the marketing measurement flywheel: A 4-step framework for proving impact help prove marketing ROI?
By creating a continuous loop of planning, measuring, analyzing, and optimizing, the marketing measurement flywheel: A 4-step framework for proving impact links marketing activities directly to business outcomes, providing clear evidence of ROI through data-driven insights and iterative improvements.
Why is the marketing measurement flywheel: A 4-step framework for proving impact better than traditional linear metrics?
Unlike one-off reports, the marketing measurement flywheel: A 4-step framework for proving impact is cyclical, building speed and efficiency with each rotation. It adapts to changing data and strategies, delivering compounding proof of impact over static, linear measurement approaches.
How can I implement the marketing measurement flywheel: A 4-step framework for proving impact in my team?
Start by aligning your team on the four steps: Plan with clear objectives, Measure using integrated tools, Analyze with advanced attribution models, and Optimize by testing changes. Regularly review the flywheel to maintain momentum in the marketing measurement flywheel: A 4-step framework for proving impact.
What tools support the marketing measurement flywheel: A 4-step framework for proving impact?
Tools like Google Analytics, Adobe Analytics, or Mixpanel for measurement; Tableau or Looker for analysis; and automation platforms like Zapier for optimization integrate seamlessly into the marketing measurement flywheel: A 4-step framework for proving impact, enabling data flow across all steps.
Leave a Reply